SQL Detail Window
SUB) Overview
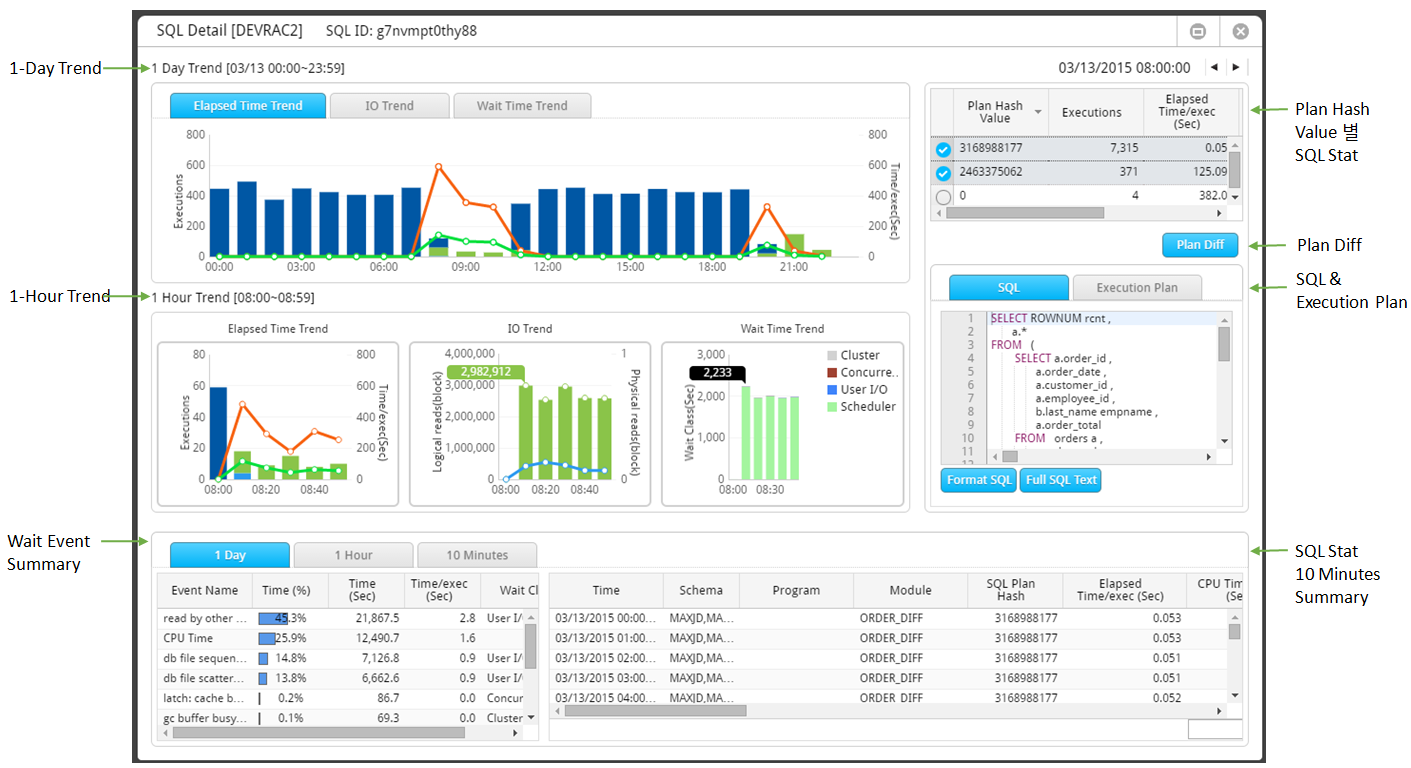
Provides the function for detailed analysis of a specific SQL. The main functions are as follows.
- 1-Day Trend: Provides the trends of the selected date’s Elapsed Time, IO, and Wait Time by each time period.
- 1-Hour Trend: Provides the trends of selected time’s Elapsed Time, IO, and Wait Time by every 10 minutes.
- Provides the information of wait events generated at the time of SQL execution by units of 1-Day, 1-Hour, and every 10 minutes.
- Provides detailed performance history in units of 10 minutes.
- SQL performance information by Plan Hash Value
- Provides the Plan Comparison function.
SUB) Window Configuration
SUB) 1-Day Trend
Provides the trends of selected date’s Elapsed Time, IO, and Wait Time by each time period.
Elapsed Time Trend Tab
Provides the hourly average trends of the corresponding SQL’s Elapsed Time, CPU Time, and Executions.
| Item | Description |
| Orange Line | Provides the hourly average value of the corresponding SQL’s Elapsed Time. |
| Green Line | Provides the hourly average value of the corresponding SQL’s CPU Time. |
| Bar Chart | Hourly sum of the corresponding SQL’s execution count.
|
IO Trend Tab
Provides the hourly average trends of the corresponding SQL’s Logical IO and Physical IO.
| Item | Description |
| Bar Chart | Provides hourly average value of the corresponding SQL’s Logical IO. |
| Line Chart | Provides the hourly average value of the corresponding SQL’s Physical IO. |
Wait Class Trend
Provides the corresponding SQL’s wait time information according to wait class (and CPU Time) by hourly.
SUB) 1-Hour Trend
Provides the trends of the time selected in the 1-Day Trend by every 10 minute.
Note. When the SQL Detail Window first pops up, the time section whose Elapsed Time is the highest in the 1-Day Trend will be displayed.
SUB) Wait Event Summary
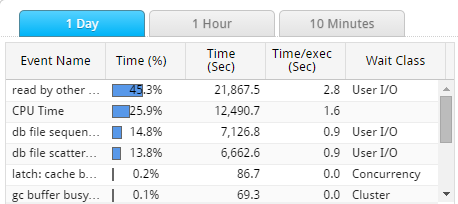
Provides the corresponding SQL information by wait event (and CPU Time).
Tab Explanation
| Tab Name | Description |
| 1-Day | Provides wait information of 1 day. |
| 1-Hour | Provides the wait information of the time section selected in the 1-Day Trend. |
| 10 Minutes | Provides the wait information of the 10 minutes selected in the 1-Hour Trend. |
Grid Column
| Column Name | Description |
| Event Name | Wait Event Name (or CPU Time) |
| Time (Sec) | Wait Time (or CPU Time) |
| Time (%) | The ratio of the corresponding wait event (or CPU Time) out of the total elapsed time. |
| Time/exec (Sec) | Average Wait Time (or Average CPU Time) |
| Wait Class | Wait Class Name
|
Grid Mouse Right-Click Menu
The mouse right-click menu is as follows. For more information, please reference “Appendix. Grid Mouse Right-Click Menu UI”.
| Item | Description |
| Export Excel | Downloads the grid content on an excel file. |
| Copy(To Clipboard) | Makes a copy of the grid content. |
| Show/ Hide Columns | Selects the columns to be displayed on the grid. |
| Filter On | Enables the Filtering function. |
| Multiple Sort On | Sorts based on 2 or more column values. |
| Save Image | Saves the grid content as an image. |
SUB) SQL Stat by Plan Hash Value
Provides the SQL performance information by Plan hash values.
Grid Column
| Column Name | Description |
| Check Button | Select the Plan Comparison Target
|
| Executions | SQL Text Executions Count by Plan hash value (Sum) |
| Elapsed Time/exec (Sec) | SQL Elapsed Time by Plan hash value (Average per Execution) |
| CPU Time/exec (Sec) | SQL CPU Time by Plan hash value (Average per Execution) |
| Wait Time/exec (Sec) | SQL Wait Time by Plan hash value (Average per Execution) |
SUB) Plan Diff
When the Plan hash value is 2 or greater, it provides the function for comparing the 2 plans. For more information, please “Chapter 9. Plan Diff Window” section.
SUB) SQL& Execution Plan
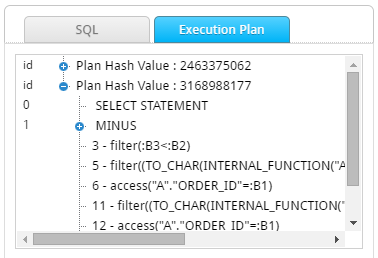
Provides the SQL statement and execution plan information.
Note. When the Plan hash value is 2 or greater, it provides each separate execution plan information.
SUB) SQL Stat 10 Minutes Summary
Provides the corresponding SQL’s summary information taken every 10 minute.
Grid Column
| Column Name | Description |
| Time | |
| Schema | Schema Name |
| Program | Program Name |
| Module | Module Name |
| SQL Plan Hash | SQL Plan hash |
| Elapsed Time/exec (Sec) | Corresponding SQL’s Elapsed Time (Average per Execution) |
| CPU Time/exec (Sec) | Corresponding SQL’s CPU Time (Average per Execution) |
| Wait Time/exec (Sec) | Corresponding SQL’s Wait Time (Average per Execution) |
| Executions | Execution Count (Sum) |
| Elapsed Time (Sec) | Corresponding SQL’s Elapsed Time (Sum) |
| CPU Time (Sec) | Corresponding SQL’s CPU Time (Sum) |
| Logical Reads (blocks) | Corresponding SQL’s Memory IO (Sum) |
| Physical Reads (blocks) | Corresponding SQL’s Physical IO (Sum) |
| Redo Size (byte) | Redo amount generated upon executing the corresponding SQL (Sum) Unit: Bytes |
| Sort Disk (count) | The number of times the corresponding SQL has executed the disk sort (Sum) |
| Sort Rows | The number of records the corresponding SQL has performed sorting (Sum) |
| Table Fetch By Rowid (count) | The number of times the corresponding SQL has accessed the table by using the ROWID. (Sum) |
| Table Fetch Continued By Rowid (count) | The number of times the corresponding SQL has accessed 2 or more blocks to fetch one record. (Sum) |
| Table Scan Blocks Gotten (block) | The number of blocks accessed by the corresponding SQL at the time of scan operation (Table Full Scan, Index Full Scan, and Index Fast Full Scan). (Sum) |
| Table Scan Rows Gotten (row) | The number of records accessed by the corresponding SQL at the time of scan operation (Table Full Scan, Index Full Scan, and Index Fast Full Scan) (Sum) |
Grid Mouse Right-Click Menu
The mouse right-click menu is as follows. For more information, please reference “Appendix. Grid Mouse Right-Click Menu UI”.
| Item | Description |
| Long-Term Trend | Connects to Long-Term Trend window for the corresponding SQL.
|
| Export Excel | Downloads the grid content on an excel file. |
| Copy(To Clipboard) | Makes a copy of the grid content. |
| Show/ Hide Columns | Selects the columns to be displayed on the grid. |
| Filter On | Enables the Filtering function. |
| Multiple Sort On | Sorts based on 2 or more column values. |
| Save Image | Saves the grid content as an image. |
Session Detail Window
SUB) Overview
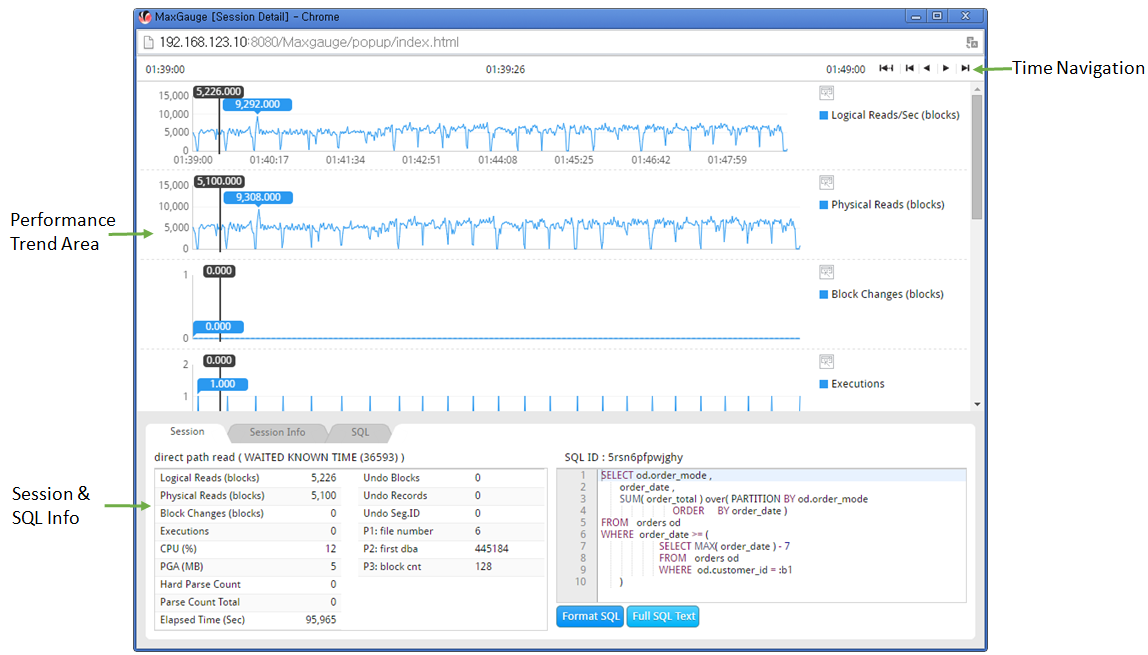
Provides the function for detailed analysis of a specific session. The main functions are as follows.
- Provides the trends of main performance indicators taken every second.
- Provides the main performance indicators’ workload, wait event and undo related information taken every second.
- Provides the session’s basic information.
- Provides the information of SQL executed in the session.
SUB) Time Silce WIndow
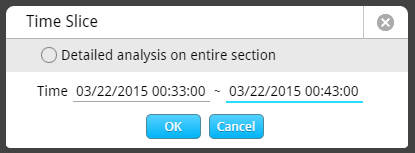
When connecting to the Session Detail Window, it provides the function for setting the analysis period.
| Item | Description |
| Detail analysis on entire section Check Box checked | Sets the Performance Trend window’s entire section as the analysis period. |
| Detail analysis on entire section Check Box unchecked | Sets the 5 minutes before and after the Performance Trend’s analysis time as the analysis period. (Default Set Value)
|
SUB) Window Configuration
SUB) Performance Trend Area
Provides the trends graph of the following performance indicators by every second.
| Item | Description |
| Logical Reads (blocks) | The number of corresponding session’s Logical IO Blocks (Value/sec) |
| Physical Reads (blocks) | The number of corresponding session’s Physical IO Blocks (Value/sec) |
| Block Changes (blocks) | The number of blocks the corresponding session has changed (Value/sec) |
| Executions | The corresponding session’s SQL execution count (Value/sec) |
| CPU (%) | The corresponding session’s CPU Usage (%) (Current value) |
| PGA (MB) | The corresponding session’s PGA Size (Current value) |
| Hard Parse | The corresponding session’s hard parsing count (Value/sec) |
| Total Parse Count | The corresponding session’s parsing count (Value/sec) |
| Undo Blocks | The number of undo blocks used by the corresponding session (Current value) |
SUB) Session & SQL Info
Session Tab
Provides the corresponding time’s (second) main performance indicator and wait events information.
- Wait Event Info: Wait Event Name
- Stat Info: The amount generated by the performance indicators provided in the Performance Trend Area. (Value/sec or Current value)
- Undo related information
- Wait Event P2/P2/P3 related information
Session Info Tab
Provides the basic information of the corresponding session.
SQL Tab Grid
Among the SQLs executed by the corresponding session, the execution information of the SQLs existing within the Session Detail Window analysis period is provided.
| Column Name | Description |
| SQL ID | SQL ID |
| SQL Text | SQL Text |
| SQL Plan Hash | SQL Plan Hash Value |
SQL Tab Grid Mouse Right-Click Menu
The mouse right-click menu is as follows. For more information, please reference “Appendix. Grid Mouse Right-Click Menu UI”.
| Item | Description |
| Full SQL Text | Provides SQL Full Text. |
| Export Excel | Downloads the grid content on an excel file. |
| Copy(To Clipboard) | Makes a copy of the grid content. |
| Show/ Hide Columns | Selects the columns to be displayed on the grid. |
| Filter On | Enables the Filtering function. |
| Multiple Sort On | Sorts based on 2 or more column values. |
| Save Image | Saves the grid content as an image. |
SUB) Analysis Time Shift Method
Double-click a specific time point in the Performance Trend Area or use Time Navigation.
SUB) Analysis Perid Extending Method
Unless you have checked the “Detail analysis on entire section” in the Time Slice Window, the analysis period extending function is provided.
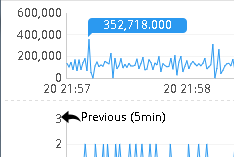
Extending Time to Previous 5 Minutes
When you put the mouse over the left axis in the Performance Trend Area and the ““Previous (5min)” appears, click to extend the period to previous 5 minutes.
Note. For example, if the current analysis period is 10:00~10:10 minutes, then it extends the analysis period to 9:55~10:10 minutes.
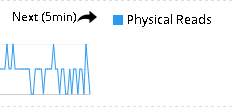
Extending Time to Next 5 Minutes
When you put the mouse over the left axis in the Performance Trend Area and the “Next (5min)” appears, click to extend the period to next 5 minutes.
Note. For example, if the current analysis period is 10:00~10:10 minutes, then it extends the analysis period to 10:00~10:15 minutes.


