Remote Sessions [Outgoing] Tool
SUB) Overview
The Remote Sessions [Outgoing] Tool monitors the sessions executing the distributed queries in a tree method through the DB link.
- Work Path: Select Menu -> Tools -> Remote Sessions [Outgoing]
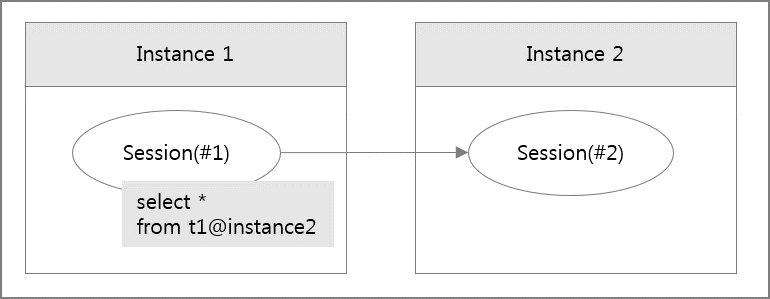
Note. As an example, let’s suppose that distributed queries are being executed through the DB link generated from Instance 1 to Instance 2, as shown below.
In this case, the tree structure of Instance 1 perceived by the Remote Sessions [Outgoing] Tool is as follows.

The window configuration is as follows.
Note. For information about functions across the top of the Window and the refresh function, please reference “Chapter 4 Common UI” section.
SUB) Active Sessions Only
When you check the box for Active Session Only, then only the sessions whose status is active will be retrieved.
SUB) Grid Column
| Column Name | Description |
| SID | Session Identifier |
| Instance Name | Instance Name |
| Schema | Schema Name (It may generally appear as a logged username, however, when executing a Recursive SQL, it will be displayed as SYS.) |
| Program | Program Name |
| Module | Module Name |
| CPID | Client Process ID |
| SPID | Server Process ID |
| Serial | Session Serial Number |
| Status | Session Status |
| Logical Reads/Sec (blocks) | Memory I/O Blocks Count (Value/sec) |
| Physical Reads/Sec (blocks) | Disk I/O Blocks Count (Value/sec) |
| Block Changes/Sec (blocks) | Changed Blocks Count (Value/sec) |
| Executions/Sec | SQL Text Execution Count (Value/sec) |
| CPU (%) | Current CPU Usage |
| PGA (MB) | Size of PGA currently in use |
| Elapsed Time (Sec) | Time elapsed from the start of SQL execution until now |
| Wait | Name of wait event currently waiting |
| SQL Text | SQL Text currently in progress |
| Action | Action Name |
| Logical Reads (Sigma) | Memory I/O Blocks Count (Cumulative Value) |
| Physical Reads (Sigma) | Memory I/O Blocks Count (Cumulative Value) |
| Block Changes (Sigma) | Disk I/O Blocks Count (Cumulative Value) |
| Executions (Sigma) | Changed Blocks Count (Cumulative Value) |
| Machine | Machine Name |
| OS User | OS User Name |
| Logon Time | Session Login Time |
SUB) Top-Down Real Time Diagnostics
When you double-click on the session list, it connects to the Session Detail Window. For more information, please reference “Chapter5 Session Detail Window” section.
SUB) Grid Mouse Right-Click Menu
Mouse Right-Click Menu is as follows. For more information, please reference “Appendix. Grid Mouse Right-Click Menu UI”.
| Item | Description |
| Export Excel | Downloads the grid content on an excel file. |
| Copy(To Clipboard) | Makes a copy of the grid content. |
| Show/ Hide Columns | Selects the columns to be displayed on the grid. |
| Expand All | Shows the expanded entire tree structure. (Parent and Child Output) |
| Collapse All | Shows the collapsed tree structure. (Only Parent Output) |
| Row Expand | Only expands the corresponding row in the Collapsed All state. |
| Row Collapse | Only collapses the corresponding row in the Expand All state. |
| Save Image | Saves the grid content as an image. |
Remote Sessions [Incoming] Tool
SUB) Overview
The Remote Sessions [Incoming] Tool monitors sessions executing the distributed queries in a tree method through the DB link.
- Work Path: Select Menu -> Tools -> Remote Sessions [Incoming]
Note. As an example, let’s suppose that distributed queries are being executed through the DB link generated from Instance 1 to Instance 2, as shown below.
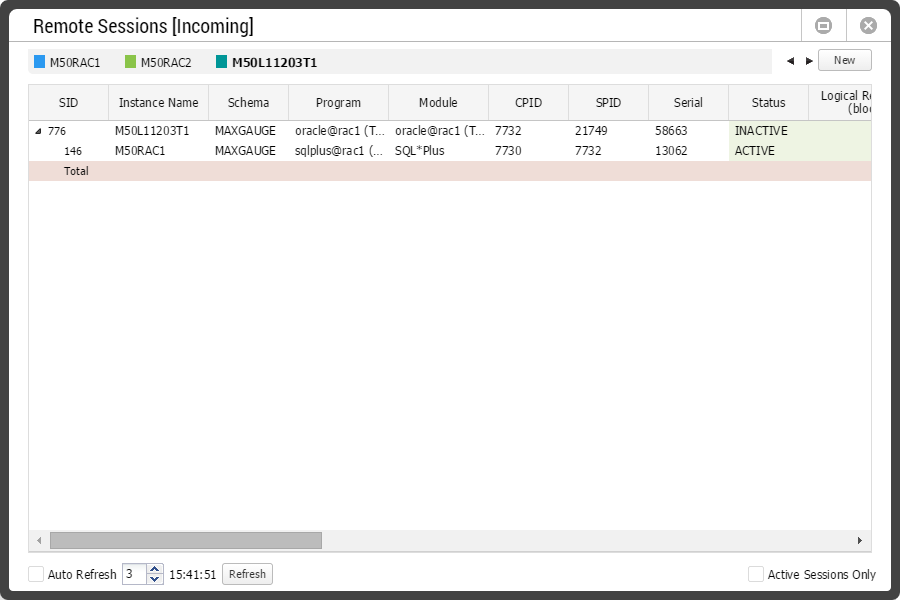
In this case, the tree structure of Instance 2 perceived by the Remote Sessions [Incoming] Tool is as follows.
The window configuration is as follows.
Regarding the Window UI, Top-Down Real Time Diagnostics, Grid Column, Grid Mouse Right-Click Menu, the information is consistent with Remote Sessions [Outgoing] Tool, therefore, please reference “Chapter 5 Remote Sessions [Outgoing] Tool” section.
Session Manager Tool
SUB) Overview
The Session Manager Tool allows you to search the sessions logged into the database with various conditions.
- Work Path: Select Menu -> Tools -> Session Manager
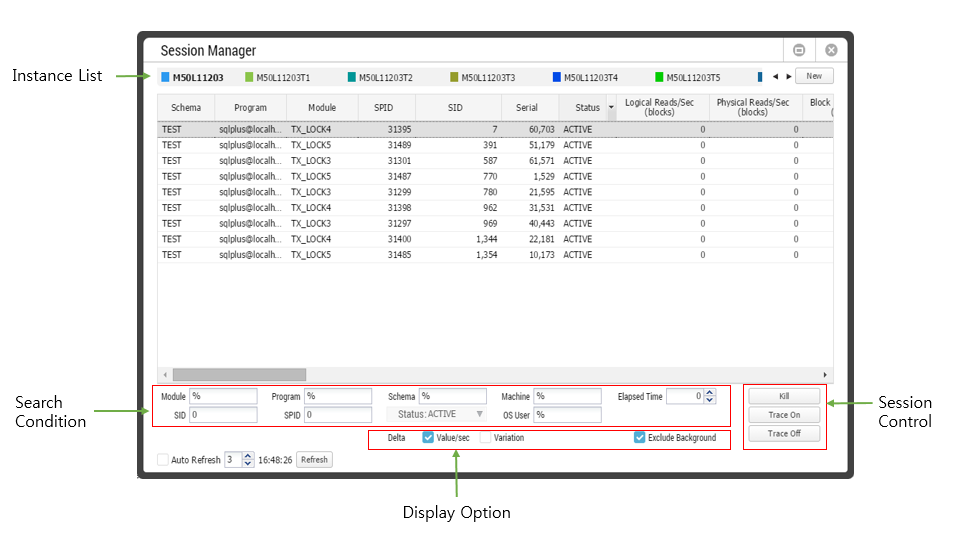
The window configuration is as follows.
Note. For information about functions across the top of the Window and the refresh function, please reference “Chapter 4 Common UI” section.
SUB) Instance List
When you click on the instance name, it performs the search under the conditions set in Search Condition.
SUB) Search Condition
Input or select the search conditions. The String column is not case-sensitive, and “%” is placed in the front and at the end of the search condition and performs the Like search.
| Item | Description |
| Module | Enter the search target module name. |
| Program | Enter the search target program name. |
| Schema | Enter the search target schema name. |
| Machine | Enter the search target machine name. |
| Elapsed Time | Set the search target SQL elapsed time.
|
| SID | Enter the search target SID. |
| SPID | Enter the search target SPID. |
| Status | Select the search target session status.
|
| OS User | Enter the search target OS User. |
SUB) Display Option
Determine the calculation method of Delta value and whether to output the background session or not.
SUB) Session Control
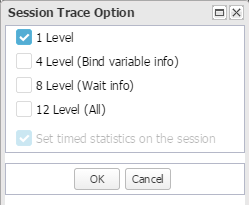
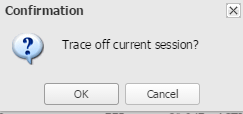
This provides the session control function.
SUB) Grid Column
| Column Name | Description |
| Schema | Schema Name |
| Program | Program Name |
| Module | Module Name
|
| SPID | Server Process ID |
| SID | Session ID |
| Serial | Serial Number |
| Status | Session Status |
| Logical Reads/Sec (blocks) | Memory I/O Blocks Count (Value/sec) |
| Physical Read/Sec (blocks) | Disk I/O Blocks Count (Value/sec) |
| Block Changes/Sec (blocks | Changed Blocks Count (Value/sec) |
| Executions/Sec | SQL Text Execution Count (Value/sec) |
| Hard Parse Count/Sec | Hard parsing Count (Values/sec) |
| Parse Count Total/Sec | Parsing Count (Value/sec) |
| Opened Cursors Current | Number of cursors currently open (Current value) |
| Undo Blocks | Number of Undo Blocks used during the transaction. (Value/Sec) |
| Undo Records | Number of Undo Record generated during the transaction (Value/Sec) |
| Undo Seg. ID | Undo Segment ID being used by the transaction |
| CPU (%) | CPU Usage (%) |
| PGA (MB) | Size of PGA currently in use |
| Elapsed Time (Sec) | Time elapsed from the start of SQL execution until now |
| Wait | Name of wait event currently waiting |
| SQL ID | Oracle SQLID |
| SQL Plan Hash | Plan hash Value |
| SQL Text | SQL Statement |
| Command Type | SQL Type (SELECT, INSERT, DELETE, UPDATE, CREATE, and etc.) |
| Action | Action Name
|
| Logical Reads (Sigma) | Memory I/O Blocks Count (Cumulative Value) |
| Physical Reads (Sigma) | Disk I/O Blocks Count (Cumulative Value) |
| Block Changes (Sigma) | Changed Blocks Count (Cumulative Value) |
| Executions (Sigma) | SQL Text Execution Count (Cumulative Value) |
| Undo Blocks (Sigma) | Number of Undo Blocks used during the transaction. (Cumulative Value) |
| Undo Records (Sigma) | Number of Undo Record generated during the transaction (Cumulative Value) |
| Machine | Machine Name |
| OS User | OS User Name |
| CPID | Client Process ID |
| System ID | OS Process User Name |
| Logon Time | Session Login Time |
| Client Identifier | Client Identifier |
| Client Info | Client Info
|
| Hash Value | SQL Text Hash Value |
| Addr | SQL Text Address Value |
| P1 | Indicates the P1 value of the wait event.
|
| P2 | Indicates the P2 value of the wait event.
|
| P3 | Indicates the P3 value of the wait event.
|
SUB) Top-Down Real Time Diagnostics
When you double-click on the session list, it will connect to the Session Detail Window. For more information about this page, please reference “5 Chapter Session Detail Window” section.
SUB) Grid Mouse Right-Click Menu
The mouse right-click menu is as follows. For information on other features except the View SQL and Session Detail discussed in this section, please reference “Appendix. Grid Mouse Right-Click Menu UI”.
| Item | Description |
| View SQL | Connects to SQL Detail window.
|
| Session Detail | Connects to Session Detail window.
|
| Export Excel | Downloads the grid content on an excel file. |
| Copy(To Clipboard) | Makes a copy of the grid content. |
| Show/ Hide Columns | Selects the columns to be displayed on the grid. |
| Filter On | Enables the Filtering function. |
| Multiple Sort On | Sorts based on 2 or more column values. |
| Save Image | Saves the grid content as an image. |
Active Sessions Frame
SUB) Overview
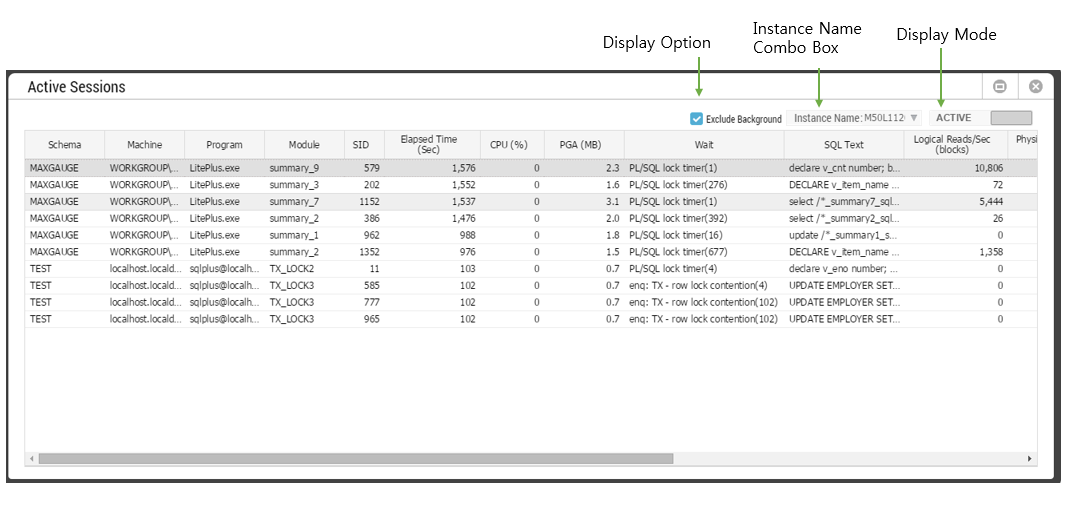
The Active Session Frame provides a list of active sessions.
- Work Path: Select Menu -> Docking Frame -> Active Sessions
The window configuration is as follows.
SUB) Display Mode
SUB) Summary Mode
The initial window of Summary Mode is as follows.
Common Columns by Tab
| Column Name | Description |
| Total Count | Total number of active sessions by grouping standards
|
| Total CPU (%) | Total CPU (%) by grouping standards |
| Total Elapsed Time (Sec) | Total elapsed time by grouping standards |
| Total Logical Reads (blocks) | Total Memory IO by grouping standards |
| Total PGA (MB) | Total PGA by grouping standards |
Schema Tab
The Schema Tab displays the result of grouping by Schema.
| Column Name | Description |
| Schema | Schema Name |
Program Tab
The Program Tab displays the result of grouping by Schema and Program names.
| Column Name | Description |
| Schema | Schema Name |
| Program | Program Name |
Module Tab
The Module Tab displays the result of grouping by Schema, Program, and Module names.
| Column Name | Description |
| Schema | Schema Name |
| Program | Program Name |
| Module | Module Name
|
SQL Tab
The SQL Tab displays the result of grouping by Schema, Program, Module, and SQLID.
| Column Name | Description |
| Schema | Schema Name |
| Program | Program Name |
| Module | Module Name
|
| SQL ID | Oracle SQLID |
| SQL Text | SQL Statement |
Mouse Right-Click Menu
The mouse right-click menu is as follows. For information on other features except the View SQL discussed in this section, please reference “Appendix. Grid Mouse Right-Click Menu UI”.
| Item | Description |
| View SQL | Connects to SQL Detail Window.
|
| Session Detail | It connects to the Session Detail Window.
|
| Export Excel | Downloads the grid content on an excel file. |
| Copy(To Clipboard) | Makes a copy of the grid content. |
| Show/ Hide Columns | Selects the columns to be displayed on the grid. |
| Filter On | Enables the Filtering function. |
| Multiple Sort On | Sorts based on 2 or more column values. |
| Save Image | Saves the grid content as an image. |
SUB) Display Option
SUB) Instance Name Combo Box
The Instance Name Combo Box provides a list of instances currently being monitored.
| View Name | Description |
| Trend View | Provides a list of all the instances currently being monitored |
| RAC View | Provides a list of instances within the corresponding RAC Group. |
| Single View | Does not provide the Instance Name combo box. |
SUB) Grid Column
The Grid Columns are consistent with the columns provided by the Session Manager Tool. Therefore, please reference “Chapter 5 Session Manager Tool” for more information.
SUB) Top-Down Real Time Diagnostics
When you double-click on the session list, it will connect to the Session Detail Window. For more information about this page, please reference “5 Chapter Session Detail Window” section.
SUB) Grid Mouse Right-Click Menu
The mouse right-click menu is as follows. For information on other features except the View SQL and Session Detail discussed in this section, please reference “Appendix. Grid Mouse Right-Click Menu UI”.
| Item | Description |
| View SQL | Connects to SQL Detail window.
|
| Session Detail | Connects to Session Detail window.
|
| Export Excel | Downloads the grid content on an excel file. |
| Copy(To Clipboard) | Makes a copy of the grid content. |
| Show/ Hide Columns | Selects the columns to be displayed on the grid. |
| Filter On | Enables the Filtering function. |
| Multiple Sort On | Sorts based on 2 or more column values. |
| Save Image | Saves the grid content as an image. |
Active Sessions (RAC) Frame
SUB) Overview
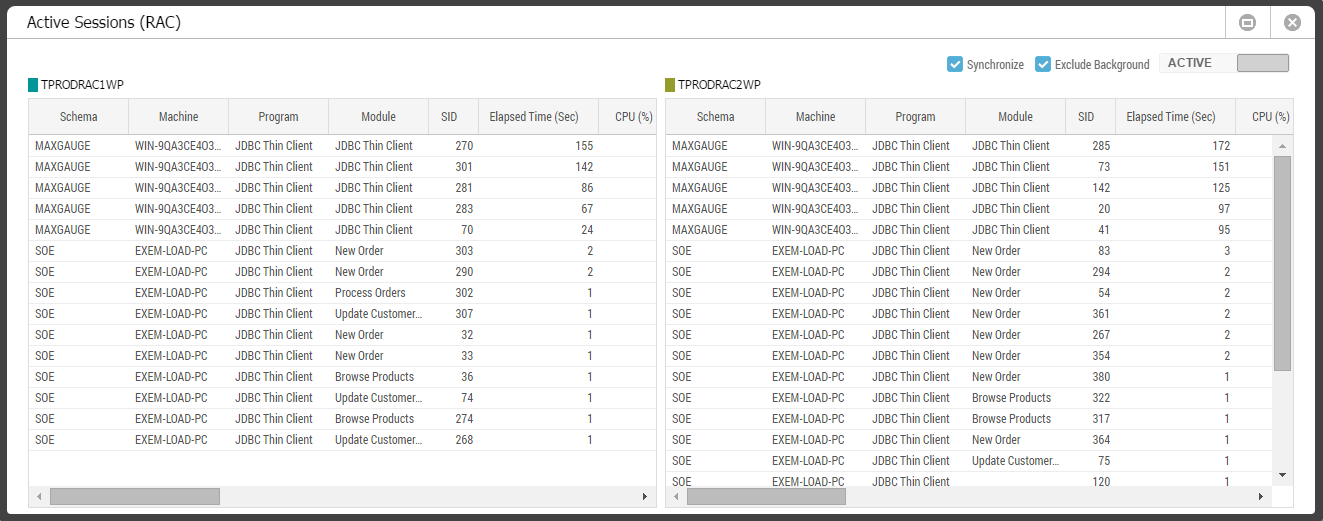
Provides a list of active sessions in a RAC environment.
- Work Path: Select Menu -> Docking Frame -> Active Sessions (RAC)
The screen configuration is as follows.
This frame is only provided on a RAC View. All UI’s are the same as the Active Session Frame, and synchorize feature is also available for user convenience.
SUB) Synchronize Feature
Active Session Current Wait Class Frame
SUB) Overview
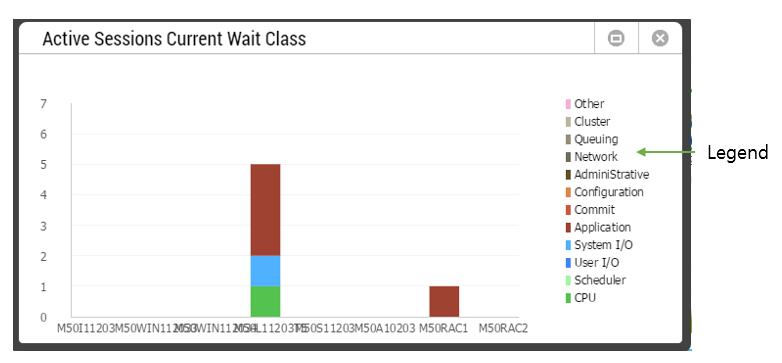
The Active Session Current Wait Class Frame provides the number of active sessions currently in the wait events, grouped according to the wait classes. The information is presented in stacked bar chart format and you can monitor 2 or more instances at the same time.
- Work Path: Select Menu -> Docking Frame -> Active Sessions Current Wait Class
The window configuration is as follows.
SUB) Legend
| Item | Description |
| Legend Title | Provides a list of Oracle Wait Class names and CPU.
|
| Legend Checkbox | Provides the Series (Oracle Wait Class or CPU) On/Off function. |
Note. The “ON CPU” status means that the V$SESSION.STATE column value is not in “WAITING” status.
SUB) Graph Area Mouse Right-Click Menu
The mouse right-click menu is as follows. For more information, please reference “Appendix. Grid Mouse Right-Click Menu UI” section.
| Item | Description |
| Save Image | Saves the grid content as an image. |
Active Session Wait Class Trend Frame
SUB) Overview
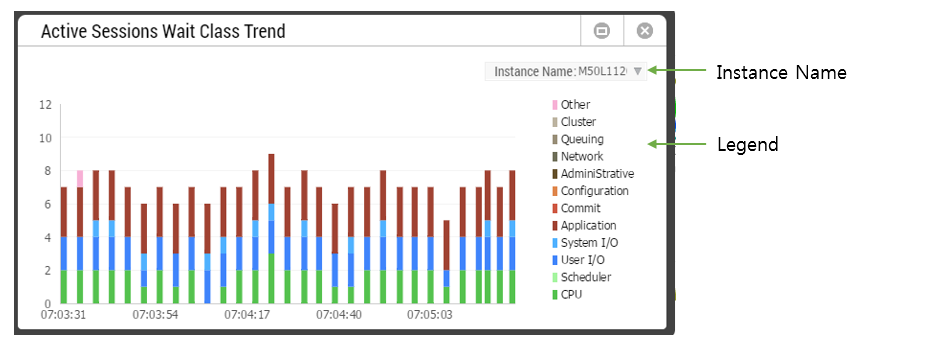
The Active Session Wait Class Trend Frame provides the number of active sessions which are currently in the wait events, grouped according to the wait classes. The information is presented in a stacked bar chart (with trend line) format and you can monitor 1 instance at a time.
- Work Path: Select Menu -> Docking Frame -> Active Sessions Current Wait Class
The window configuration is as follows.
SUB) Instance Name
The Instance Name provides a list of instances currently being monitored.
| View Name | Description |
| Trend View | Provides a list of all the instances currently being monitored |
| RAC View | Provides a list of instances within the corresponding RAC Group. |
| Single View | Does not provide the Instance Name combo box. |
SUB) Legend
| Item | Description |
| Legend Title | Provides a list of Oracle Wait Class names and CPU.
|
| Legend Checkbox | Provides the Series (Oracle Wait Class or CPU) On/Off function. |
Note. The “ON CPU” status means that the V$SESSION.STATE column value is not in
SUB) Graph Area Mouse Right-Click Menu
The mouse right-click menu is as follows. For more information, please reference “Appendix. Grid Mouse Right-Click Menu UI” section.
| Item | Description |
| Save Image | Saves the grid content as an image. |
Active Sessions Group
SUB) Overview
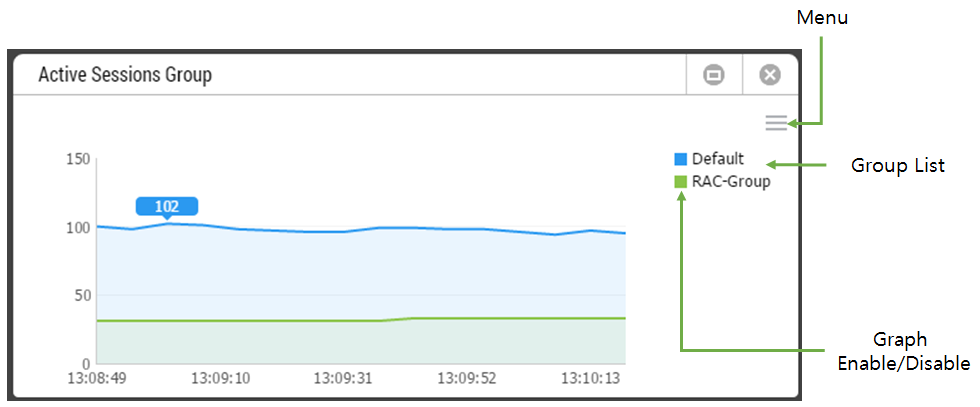
Provides the number of active sessions grouped based on instance groups. Provided in a line chart format and you can monitor 2 or more groups simultaneously.
- Work Path: Select Menu -> Docking Frame -> Active Sessions group
The screen configuration is as follows.
SUB) Menu
The functions provided in the menu are as follows.
Legend Off
Hides the legend in case of a line chart. The corresponding function is only available for a line chart.
Group List
Provides a list of instance groups currently being monitored.
SUB) Graph Enable/Disable
You can use the the checkbox in front of the Group to turn on/off the graph display function.
SUB) Graph Area Mouse Right-Click Menu
The mouse right-click menu is as follows. For more information, please reference “Appendix. Grid Mouse Right-Click Menu UI” section.
| Item | Description |
| Save Image | Saves the grid content as an image. |
Long Active Session Count Frame
SUB) Overview
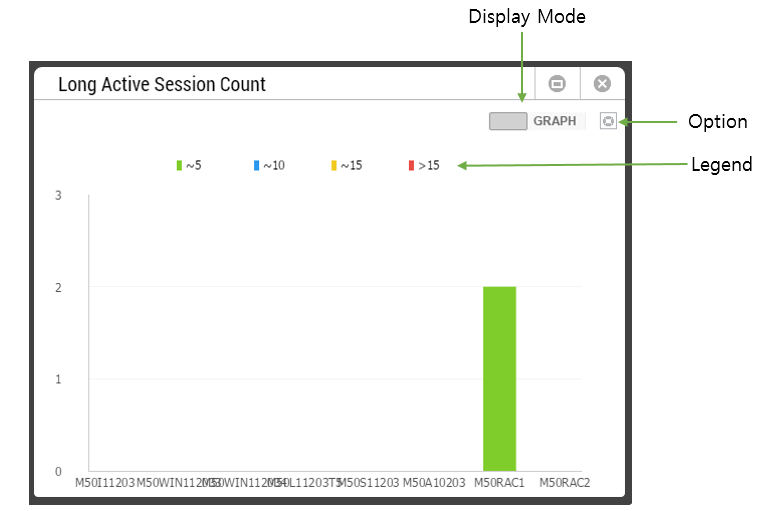
The Long Active Session Count Frame provides the number of active sessions grouped according the SQL elapsed time ranges. The information is provided in a stacked bar chart format and you can simultaneously monitor 2 or more instances at the same time.
- Work Path: Select Menu -> Docking Frame -> Long Active Session Count
The window configuration is as follows.
SUB) Display Mode
SUB) Legend
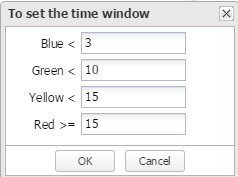
The Legend provides the elapsed time range represented by each of the stacked bar series color. The elapsed time range can be adjusted on the options menu.
| Stacked Bar Series Color | Elapsed Time Range |
| Blue | Less than 3 seconds |
| Green | Less than 10 seconds |
| Yellow | Less than 15 seconds |
| Red | More than 15 seconds |
SUB) Option Button
SUB) Grid Mode
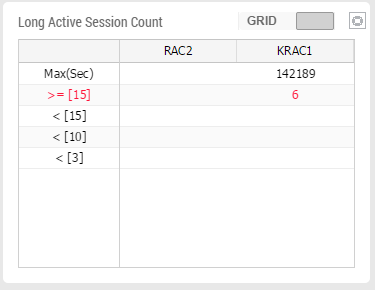
The Grid Mode provides the number of sessions according to the Lock waiting time range in a grid format. Max (sec) refers to the longest Lock waiting time (sec) by instance.
Lock Waiting Session Count Frame
SUB) Overview
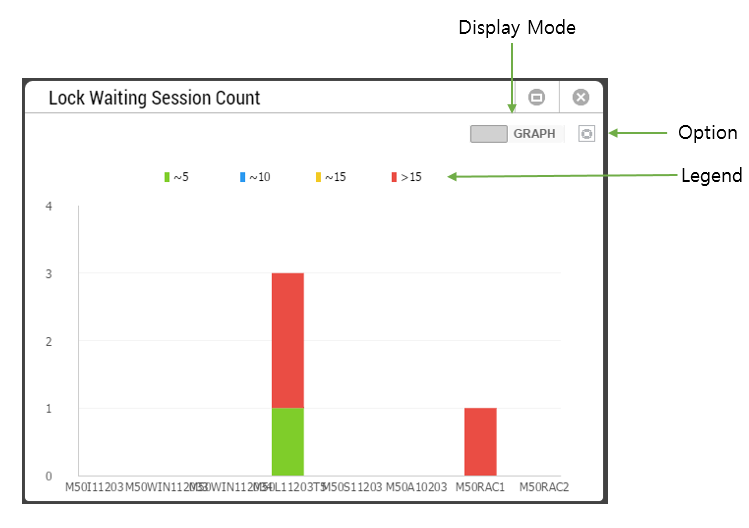
The Lock Waiting Session Count Frame provides the number of Lock waiting sessions grouped according to the lock waiting time range. The information is provided in a stacked bar chart format and you can simultaneously monitor 2 or more instances at the same time.
- Work Path: Select Menu -> Docking Frame -> Lock Waiting Session Count
The window configuration is as follows.
SUB) Display Mode
SUB) Legend
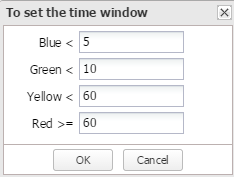
The Legend provides the lock waiting time range respresented by each of the stacked bar series color. The lock waiting time range can be adjusted on the options menu.
| Stacked Bar Series Color | Lock Waiting Time Range |
| Blue | Less than 5 seconds |
| Green | Less than 10 seconds |
| Yellow | Less than 60 seconds |
| Red | More than 60 seconds |
SUB) Option Button
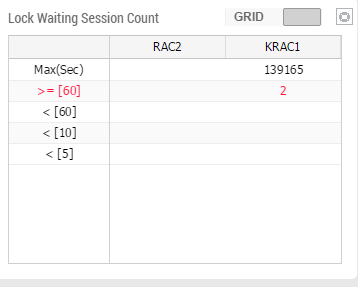
SUB) Grid Mode
The Grid Mode provides the number of sessions according to the elapsed time range in a grid format. Max (sec) refers to the longest elapsed time (sec) by instance.
SUB) Top-Down Real Time Diagnostics
When you click on the bar on the Graph Mode or the cell on the Grid Mode, it connects to the Lock Tree Frame. For more information about this page, please reference “Chapter 5 Lock Tree Frame” section.
Lock Tree Frame
SUB) Overview
The Lock Tree Frame provides the relationship between the Lock holder and the waiter in a tree structure.
- Work Path: Select Menu -> Docking Frame -> Lock Tree
The window configuration is as follows.
SUB) Instance Name
The Instance Name provides a list of instances currently being monitored.
| View Name | Description |
| Trend View | Provides a list of all the instances currently being monitored |
| RAC View | Provides a list of instances within the corresponding RAC Group. |
| Single View | Does not provide the Instance Name combo box. |
SUB) Parent Node
The Parent Node provides detailed information on Lock holder.
SUB) Child Node
The Child Node provides detailed information on Lock waiter.
SUB) Grid Column
| Column Name | Description |
| SID | Session Identifier |
| SPID | Server Process ID |
| Instance Name | Instance Name |
| Type Held | Lock held type of the session holding the Lock |
| Mode Held | Lock held mode of the session holding |
| Type Requested | Lock held type of the session requesting the Lock |
| Mode Requested | Lock held mode of the session requesting the Lock |
| Status | Session Status |
| Wait | Name of the event currently waiting |
| SQL ID | Oracle SQLID |
| SQL Plan Hash | Plan hash Value |
| SQL Text | SQL Statement |
| Elapsed Time | Time elapsed from the start of SQL execution until now |
| Client Identifier | Client Identifier |
| Program | Program Name |
| Module | Module Name
|
| Action | Action Name
|
| Schema | Schema Name |
| Machine | Machine Name |
| OS User | OS User Name |
| Logon Time | Session Login Time |
| Serial | Session Serial Number |
| User Name | Oracle User Name |
SUB) Top-Down Real Time Diagnostics
When you double-click the session list, it connects to the Session Detail Window. For more information about this page, please reference “Chapter 5 Session Detail Window” section.
SUB) Grid Mouse Right-Click Menu
The mouse right-click menu is as follows. For information on other features except the View SQL and Session Detail discussed in this section, please reference “Appendix. Grid Mouse Right-Click Menu UI”.
| Item | Description |
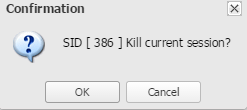
| Kill Session | After a confirmation as shown below, it kills the selected session. |
| View SQL | Connects to SQL Detail window.
|
| Session Detail | Connects to Session Detail window.
|
| Export Excel | Downloads the grid content on an excel file. |
| Copy(To Clipboard) | Makes a copy of the grid content. |
| Show/ Hide Columns | Selects the columns to be displayed on the grid. |
| Expand All | Shows the expanded entire tree structure. (Parent and Child Output) |
| Collapse All | Shows the collapsed tree structure. (Only Parent Output) |
| Row Expand | Only expands the corresponding row in the Collapsed All state. |
| Row Collapse | Only collapses the corresponding row in the Expand All state. |
| Save Image | Saves the grid content as an image. |
PQ Sessions Frame
SUB) Overview
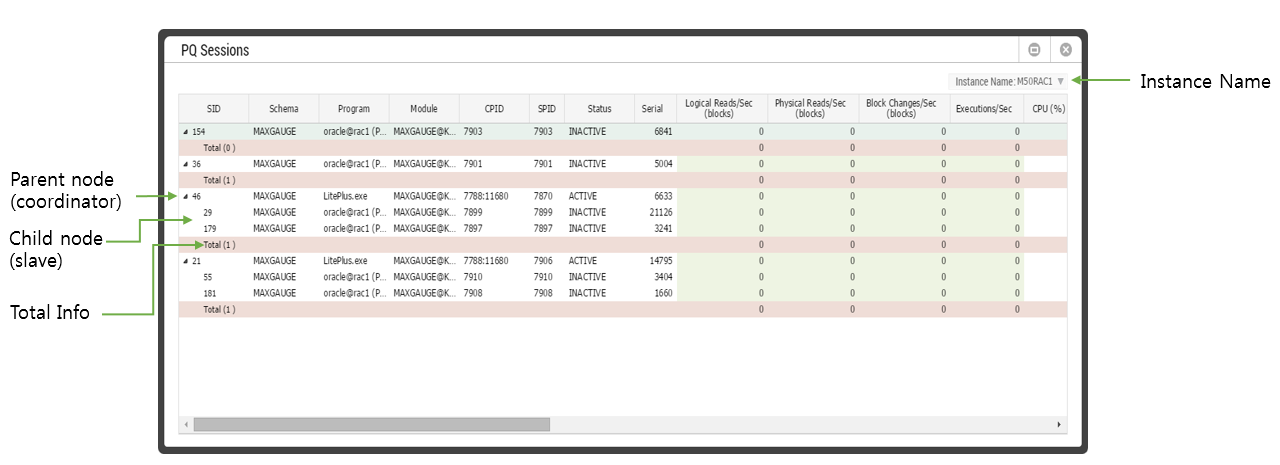
The PQ Sessions Frame provides the relationship between the coordinator and the session of slave in a tree structure.
- Work Path: Select Menu -> Docking Frame -> PQ Sessions
The window configuration is as follows.
SUB) Instance Name
The Instance Name provides a list of instances currently being monitored.
| View Name | Description |
| Trend View | Provides a list of all the instances currently being monitored |
| RAC View | Provides a list of instances within the corresponding RAC Group. |
| Single View | Does not provide the Instance Name combo box. |
SUB) Parent Node
The Parent Node provides detailed information about the Coordinator session.
SUB) Child Node
The Child Node provides detailed information about the Slave sessions.
SUB) Total Info
SUB) Grid Column
| Column Name | Description |
| SID | Session identifier |
| Schema | Schema Name |
| Program | Program |
| Module | Module Name
|
| CPID | Client Process ID |
| SPID | Server Process ID |
| Status | Session Status |
| Serial | Serial Number |
| Logical Reads/Sec (blocks) | Memory I/O Blocks Count (Value/sec) |
| Physical Reads/Sec (blocks) | Disk I/O Blocks Count (Value/sec) |
| Block Changes/Sec (blocks) | Changed Blocks Count (Value/sec) |
| Execution/Sec | SQL Text Execution Count (Value/sec) |
| CPU (%) | CPU Usage (%) |
| PGA (MB) | Size of PGA currently being used |
| Elapsed Time (Sec) | Time elapsed from the start of SQL execution until now |
| Wait | Name of the event currently waiting |
| SQL ID | Oracle SQLID |
| SQL Plan Hash | Plan hash Value |
| SQL Text | SQL Statement |
| Action | Action Name
|
| Logical Reads (Sigma) | Memory I/O Blocks Count (Cumulative Value) |
| Physical Reads (Sigma) | Disk I/O Blocks Count (Cumulative Value) |
| Block Changes (Sigma) | Changed Blocks Count (Cumulative Value) |
| Executions (Sigma) | SQL Text Execution Count (Cumulative Value) |
| OS User | OS User Name |
| Machine | Machine Name |
| Logon Time | Session Login Time |
SUB) Top-Down Real Time Diagnostics
When you double-click the session list, it connects to the Session Detail Window. For more information about this page, please reference “Chapter 5 Session Detail Window” section.
SUB) Grid Mouse Right-Click Menu
The mouse right-click menu is as follows. For information on other features except the View SQL and Session Detail discussed in this section, please reference “Appendix. Grid Mouse Right-Click Menu UI”.
| Item | Description |
| View SQL | Connects to SQL Detail window.
|
| Session Detail | Connects to Session Detail window.
|
| Export Excel | Downloads the grid content on an excel file. |
| Copy(To Clipboard) | Makes a copy of the grid content. |
| Show/ Hide Columns | Selects the columns to be displayed on the grid. |
| Expand All | Shows the expanded entire tree structure. (Parent and Child Output) |
| Collapse All | Shows the collapsed tree structure. (Only Parent Output) |
| Row Expand | Only expands the corresponding row in the Collapsed All state. |
| Row Collapse | Only collapses the corresponding row in the Expand All state. |
| Save Image | Saves the grid content as an image. |
Session Connection Info Frame
SUB) Overview
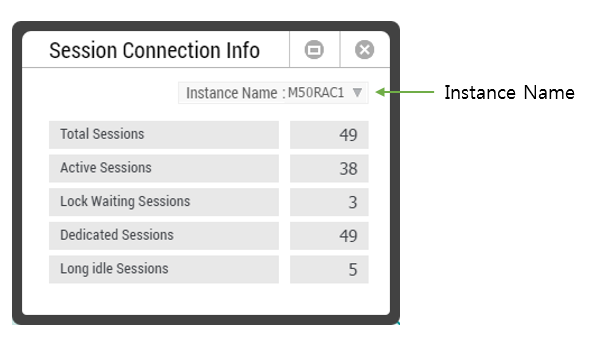
The Session Connection Info Frame provides the count of each session’s type.
- Work Path: Select Menu -> Docking Frame -> Session Connection Info
The screen will appear as follows.
SUB) Instance Name
The Instance Name provides a list of instances currently being monitored.
| View Name | Description |
| Trend View | Provides a list of all the instances currently being monitored |
| RAC View | Provides a list of instances within the corresponding RAC Group. |
| Single View | Does not provide the Instance Name combo box. |
SUB) Top-Down Real Time Diagnostics
When you click the number next to the performance indicator, it will connect to the connection window according to the performance indicator as follows.
| Performance Indicator | Connection Window | Content Provided |
| Total Sessions | Session Manager Tool | A list of all the sessions currently connecting. |
| Active sessions | Session Manager Tool | Active Session List (background session included) |
| Active User Session | Session Manager Tool | Active Session List
(background session not included) |
| Lock Waiting Sessions | Lock Tree Frame | Lock Tree |
| Long idle sessions | Session Manager Tool | A list of sessions whose inactive status has exceeded 3,600 seconds. |
Process Monitor Tool
SUB) Overview
The Process Monitor Tool provides a list of top processes.
- Work Path: Select Menu -> Docking Frame -> Process Monitor
The screen will appear as follows.
SUB) Instance Name
The Instance Name provides a list of instances currently being monitored.
| View Name | Description |
| Trend View | Provides a list of all the instances currently being monitored |
| RAC View | Provides a list of instances within the corresponding RAC Group. |
| Single View | Does not provide the Instance Name combo box. |
SUB) Top Process Tab
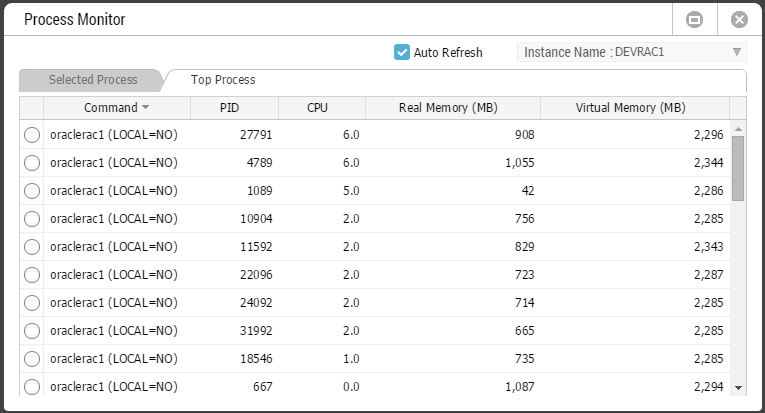
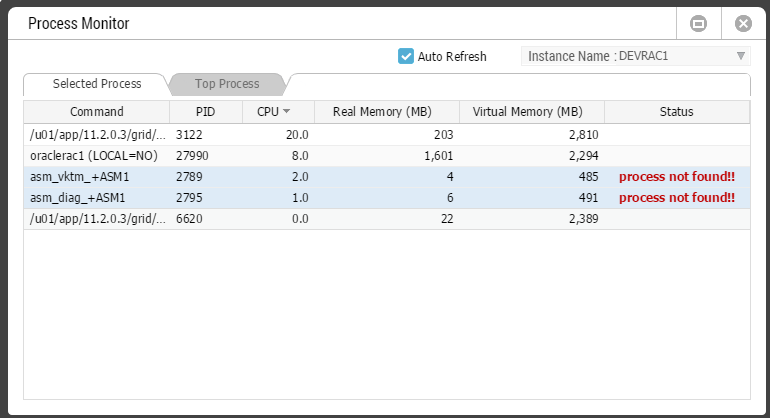
The Top Process Tab provides a list of top 50 processes based on the CPU usage and memory size.
Note. When retrieving top -50 processes based on 2 standards, any duplicates will be deleted and hence, the total number of processes retrieved may be less than 100.
SUB) Selected Process Tab
The Selected Process Tab provides a list of selected processes from the Top Process Tab. If the selected process has been terminated, then it will be indicated as “process not found” in the Status Column.
SUB) Grid Column
| Column Name | Description |
| Command | Command currently in progress |
| PID | OS process ID |
| CPU | Current CPU usage(%) |
| Real Memory (MB) | Size of Real Memory currently in use |
| Virtual Memory (MB) | Size of Virtual Memory currently in use |
| Status | Once the process is terminated, it will output the message, “process not found”.
This column is only provided in the Selected Process Tab. |
SUB) Grid Mouse Right-Click Menu
The mouse right-click menu is as follows. For more information, please reference “Appendix. Grid Mouse Right-Click Menu UI”.
| Item | Description |
| Export Excel | Downloads the grid content on an excel file. |
| Copy(To Clipboard) | Makes a copy of the grid content. |
| Show/ Hide Columns | Selects the columns to be displayed on the grid. |
| Save Image | Saves the grid content as an image. |
Top Session (Stat) Window
SUB) Overview
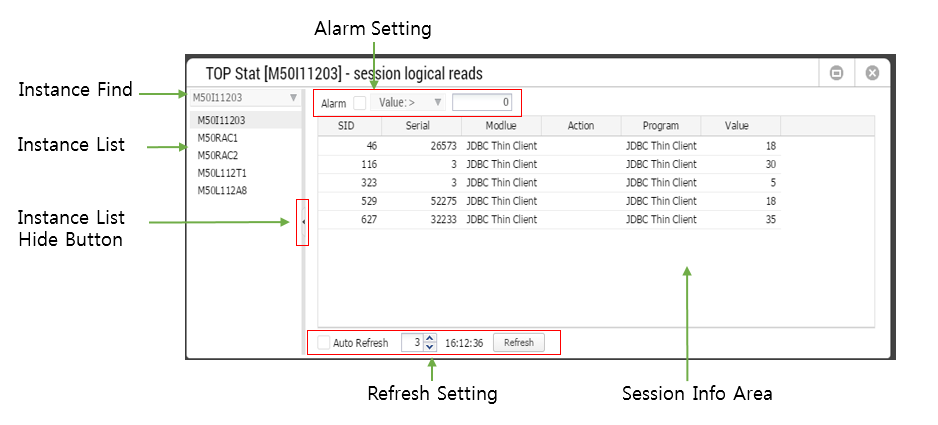
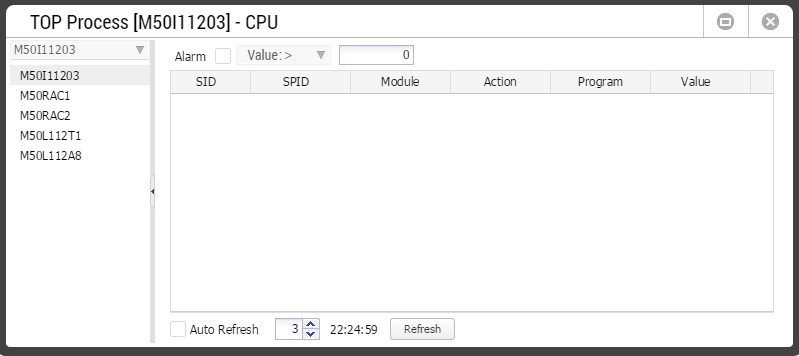
The Top Session (Stat) Window provides a list of top 20 sessions of each performance indicator. The window configuration is as follows. The left panel provides the instance list, and the right pane provides a list of top sessions for the instance you’ve selected from the left panel.
Note. The left panel is available only when the Trend Chart is monitoring with a line chart (legend off).
SUB) Instance Find
The Instance Find provides not only the instance list as a combo box, but it also provides the search function. For information about the search function, please reference “Chapter 4 Auto-complete Function” section.
SUB) Instance List
The Instance List displays all the instances currently being monitored. When you click on the Instance name, a list of top sessions regarding the corresponding instance will be displayed in the Session Info Area.
SUB) Instance List Hide Button
The Instance List Hide Button hides the left panel.
SUB) Alarm Settings
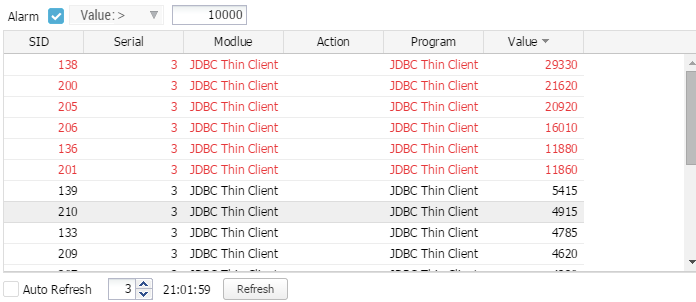
You can set the alarms for each session.
| Item | Description |
| |
Enable the Alarm settings. |
 |
Select a sign. The default setting is “>”. |
| |
Enter the threshold value. |
The sessions which satisfy the conditions set for the alarm will be indicated in red.
Note. This is the only warning (session information changing to red) the Session alarm provides.
SUB) Refresh Setting
The Refresh Setting controls the Refresh related actions. For more information, please reference “Chapter 4 Tool Common UI” section.
SUB) Grid Column
| Column Name | Description |
| SID | Session ID |
| Serial | Serial Number |
| Module | Module Name
|
| Action | Action Name
|
| Program | Program Name |
| Value | Average Value per second (value/sec) |
SUB) Top-Down Real Time Diagnostics
When you double-click the session list, it will connect to the Session Detail Window. For more information about this page, please reference “Chapter 5 Session Detail Window” section.
SUB) Grid Mouse Right-Click Menu
The mouse right-click menu is as follows. For more information, please reference “Appendix. Grid Mouse Right-Click Menu UI”.
| Item | Description |
| Export Excel | Downloads the grid content on an excel file. |
| Copy(To Clipboard) | Makes a copy of the grid content. |
| Show/ Hide Columns | Selects the columns to be displayed on the grid. |
| Filter On | Enables the Filtering function. |
| Multiple Sort On | Sorts based on 2 or more column values. |
| Save Image | Saves the grid content as an image. |
Top Process (Event) Window
SUB) Overview
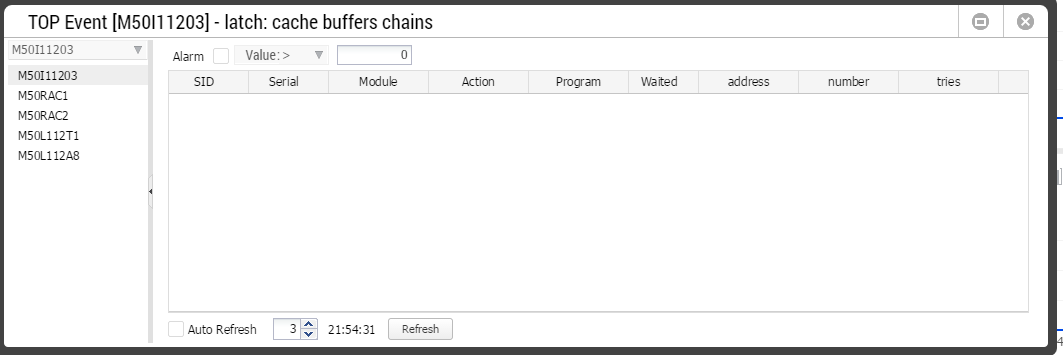
The Top Session (Event) Window provides a list of top 20 sessions of each wait event. The window configuration is as follows.
All other functions are consistent with the Top Session(Stat) Window, except the Grid Column. Therefore, for more information, please reference “Chapter 5 Top Session(Stat) Window” section.
SUB) Grid Column
| Column Name | Description |
| SID | Session ID |
| Serial | Serial Number |
| Module | Module Name
|
| Action | Action Name
|
| Program | Program Name |
| Time Waited (Seconds) | Corresponding Wait Event’s Wait Time |
| P1 (parameter name) | Indicates the P1 value of the wait event.
|
| P2 (parameter name) | Indicates the P2 value of the wait event.
|
| P3 (parameter name) | Indicates the P3 value of the wait event.
|
Top Process Window
SUB) Overview
The Top Process Window provides information regarding the top 20 processes of each OS performance indicator. The window configuration is as follows.
All other functions are consistent with the Top Session(Stat) Window, except the Grild Column. Therefore, please reference “Chapter 5 Top Session(Stat) Window” section.
SUB) Grid Column
| Column Name | Description |
| SID | Session ID
|
| SPID | OS process ID |
| Module | Module Name
|
| Action | Action Name
|
| Program | Program Name
|
| Value | Provides the current generated value by each OS indicator. |
Session Detail Window
SUB) Overview
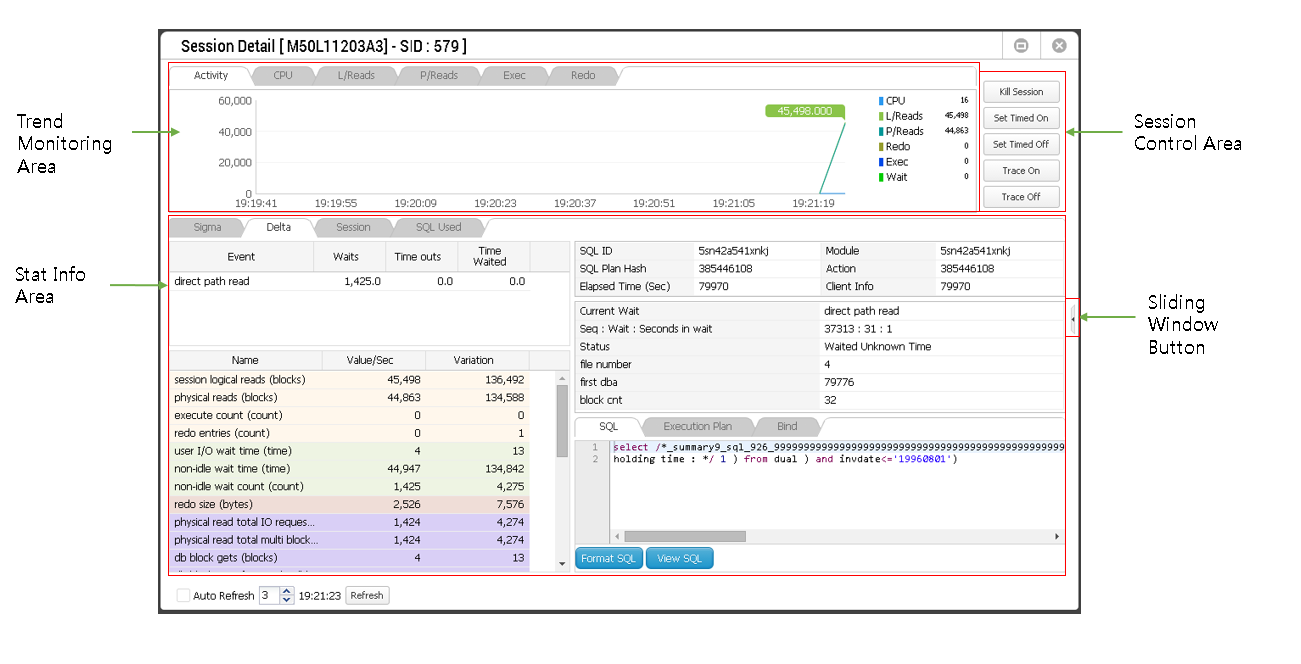
The Session Detail Window provides the function through which you can monitor session information. It connects to various Tools and Frames mentioned in previous sections. The window configuration is as follows.
SUB) Trend Monitoring Area
The Trend Monitoring Area provides trends of main performance indicators.
Activity Tab
The Activity Tab provides trends of the following performance indicators.
| Legend Title | Description |
| CPU | Corresponding session’s OS CPU usage (%) |
| L/Reads | Corresponding session’s Memory I/O Blocks Count (Value/sec) |
| P/Reads | Corresponding session’s Disk I/O Blocks Count (Value/sec) |
| Redo | Corresponding session’s Redo Entry Generated Value (Value/sec) |
| Exec | Corresponding session’s SQL Text Execution Count (Value/sec) |
| Wait | Corresponding session’s Total Waiting Time (Value/sec) |
CPU Tab
The CPU Tab provides system and session level trends of the OS CPU usage (%).
L/Read Tab
The L/Read Tab provides system and session level trends of Memory IO Blocks Count (Value/Sec).
P/Read Tab
The P/Read Tab provides system and session level trends of Disk IO Blocks Count (Value/Sec).

Exec Tab
The Exec Tab provides system and session level trends of SQL Execution Count (Value/Sec).
Redo Tab
The Redo Tab provides system and session level trends of Redo Entry Generated Value (Value/Sec).
SUB) Session Control Area
The Session Control Area provides the session control function.
SUB) Stat Info Area
The Stat Info Area provides various session performance information through Sigma, Delta, Session, and SQL Used Tab.
SUB) Sigma Tab
The Sigma Tab window configuration is as follows.
Performance Indicator Cumulative Value
The Performance Indicator Cumulative Value is provided for each performance indicator.
| Column Name | Description |
| Name | Performance Indicator Name |
| Value | Performance Indicator Cumulative Value |
| Avg | Average value (Value/Second) from the start of session login until now.
|
Note. Depending on the types of performance indicator, it may show the current value instead of the cumulative value. For example, performance indicators containing the word “current” such as logons current, opened cursors current, and others like uga memory, uga memory max, pga memory and pga memory max will display current values.
Wait Event Cumulative Value
The Wait Event Cumulative Value provides the cumulative value for each wait event.
| Column Name | Description |
| Event | Wait Event Name |
| Total Waits | Cumulative Wait Count for each waiting event |
| Total Timeouts | Cumulative Timeout Count for each waiting event |
| Time Waited (Sec) | Cumulative Wait Time for each waiting event |
Logon Time and CPU Usage Time
| Item | Description |
| Seconds After Logon (Sec) | Time elapsed from the start of session login until now. |
| CPU used by this session (Sec) | CPU Time used from the start of User Call until now. |
| recursive cpu usage (Sec) | CPU Time used by Recursive Call |
| parse time cpu (Sec) | CPU Time used by Parsing (Hard, Soft) |
SUB) Delta Tab
The Delta Tab will be displayed by default when you connect to the Session Detail Window. The Default Tab screen will appear as follows.
Wait Event Delta Value
The Wait Event Delta Value provides the average value per second (value/second) by wait events generated in between the Refresh periods.
| Column Name | Description |
| Event | Wait Event Name |
| Waits | Number of wait events generated |
| Timeouts | Number of Timeouts by each wait event |
| Time Waited (Sec) | Wait time by each wait event |
Performance Indicator Delta Value
The Performance Indicator Delta Value is the delta value of the performance indicator generated in between the Refresh periods.
| Column Name | Description |
| Name | Performance Indicator Name |
| Value/Sec | Average Value Per Second by Each Performance Indicator
|
| Variation | Delta value by each performance indicator |
Session & SQL Main Information
The Session and SQL related main information is provided.
| Item | Description |
| SQL ID | Oracle SQLID |
| SQL Plan Hash | Plan hash Value |
| Elapsed Time (Sec) | Time elapsed from the start of SQL until now |
| Module | Module Name |
| Action | Action Name |
| Client Info | Client Info |
Current Wait Event Information
The information of current wait events is provided.
| Item | Description |
| Current Wait | Name of current wait events |
| Seq: Wait: Seconds in wait |
|
| Status | Provides the same information as V$SESSION_WAIT.STATE Column |
| P1 (p1 parameter) | Provides Wait Event P1 information |
| P2 (p2 parameter) | Provides Wait Event P2 information |
| P3 (p3 parameter) | Provides Wait Event P3 information |
Note. For information regarding V$SESSION_WAIT, please reference the Oracle document in the URL below. https://docs.oracle.com/cd/B28359_01/server.111/b28320/dynviews_3023.htm
SQL Related Information
The SQL statement, execution plan, and bind information is provided.
| Item | Description |
| SQL Tab | Provides the SQL statement. |
| Execution Plan Tab | Provides the execution plan. |
| Bind Tab |
|
| Format Button | Formats the SQL statement. |
| View SQL Button | Connects to the SQL Detail Window.
For more information, please reference “Chapter 6 SQL Detail Window” section. |
Note. To check whether the Oracle Diagnostic pack license has been acquired or not, use the control_management_pack_access oracle parameter. If the corresponding parameter value is NONE, it means that the license has not been purchased.
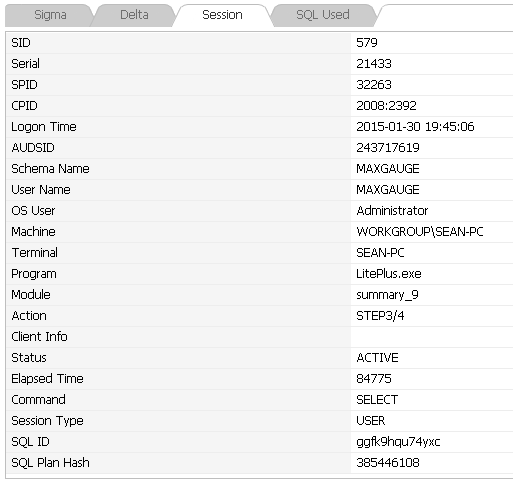
SUB) Session Tab
The Session Tab provides the session information.
| Item | Description |
| SID | Session ID |
| Serial | Serial Number |
| SPID | Server Process ID |
| CPID | Client Process ID |
| Logon Time | Session Login Time |
| AUDSID | Auditing Session ID |
| Schema Name | Schema Name |
| User Name | Oracle User Name |
| OS User | OS User Name |
| Machine | Machine Name |
| Terminal | Terminal Name |
| Program | Program Name |
| Module | Module Name |
| Action | Action Name |
| Client Info | Client Info |
| Status | Session Status |
| Elapsed Time | Elapsed time from the start of SQL until now |
| Command | SQL Type (SELECT, INSERT, DELETE, UPDATE, CREATE, and etc.) |
| Session Type | Session Type (USER, BACKGROUND, and etc.) |
| SQL ID | Oracle SQLID |
| SQL Plan Hash | Plan Hash Value |
SUB) SQL Used Tab
The SQL Used Tab provides the SQL execution information from the start time of session monitoring.
| Column Name | Description |
| SQL Text | SQL Statement |
| SQL ID | Oracle SQLID |
| Address | SQL Text Address Value |
| Hash Value | SQL Text Hash Value |
Top-Down Real Time Diagnostics
When you double click the SQL list, it connects to the SQL Detail Window. For more information, please reference “Chapter 6 SQL Detail Window” section.
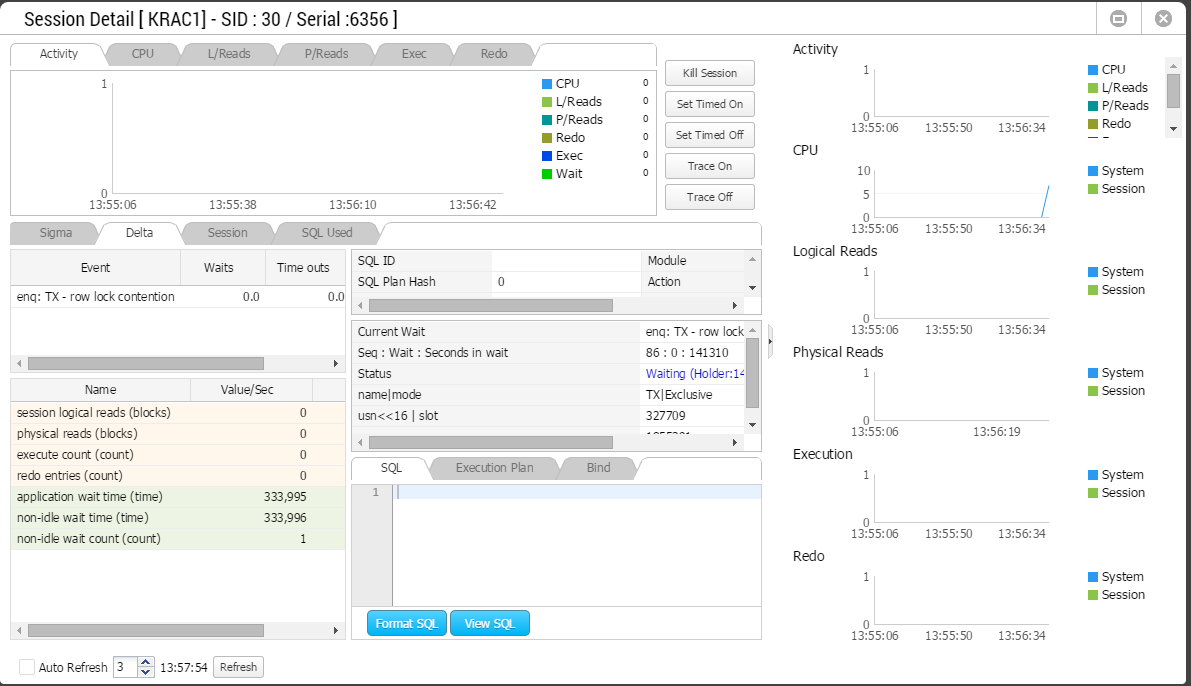
SUB) Sliding Window Button
When you click the Sliding Window button, it displays the sliding window on which you will be able to view 6 tabs in a glance within the Trend Monitoring Area.


