rt_title2

MAIN) 3. Real Time Monitoring Views

The patterns of database monitoring for database performance management can be largely divided into 3 types of patterns.

  • Monitoring multiple databases
  • RAC monitoring
  • Individual database monitoring

MaxGauge offers 3 views appropriate for these types of monitoring patterns.

  • Trend View
  • RAC View
  • Single View

Back To Top

Trend View

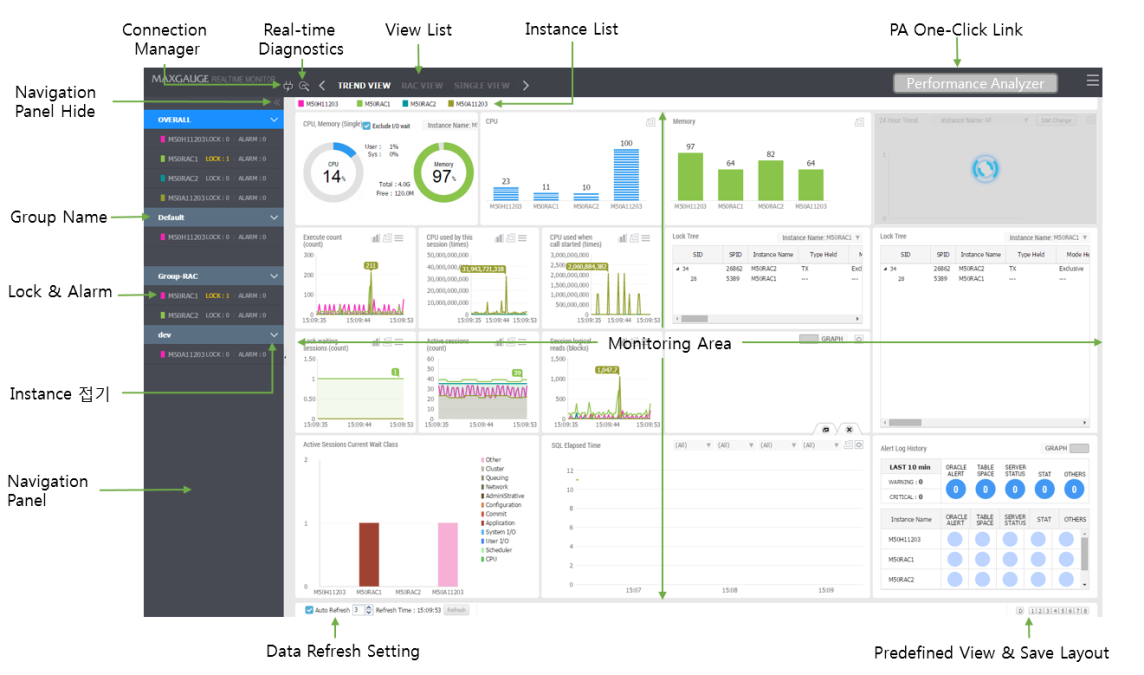
The Trend View is used for simultaneously monitoring multiple instances. The Trend View’s default window will look like the following.

18

Back To Top

SUB) Connection Manager

The Connection Manager is used to add an instance as a monitoring target or to remove an instance currently being monitored as a monitoring target. For more details, please reference the “Chapter 1. Connection Manager” section.

Back To Top

SUB) Real-time Diagnostics

The Real-time Diagnostics is used to diagnose performance issues in real time. For more details, please reference the “Chapter 7. Real-time Diagnostics” section.

Back To Top

SUB) View List

The View List provides a list of views provided in MaxGauge Real-time Client. There are 3 views currently available – Trend View, Rac View, and Single View. When you click on each name, you will be directed to its corresponding view.

Back To Top

SUB) Instance List

The Instance List provides a list of all the instances currently being monitored. When you click on the instance name, you will be directed to the Single View window of its corresponding instance.

Back To Top

SUB) PA One-Click Link

The PA One-Click Link provides a function through which you can connect to the MaxGauge Performance Analyzer.

Back To Top

SUB) Navigation Panel

The Navigation Panel provides a list of all instances currently being monitored and the alarms.

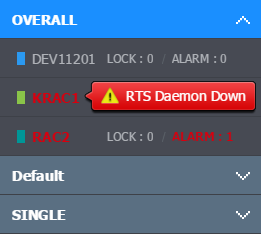
MaxGauge provides the following warning screen during the DB Down, MaxGauge Agent (RTS) Down, Listener Stop.

19

Down message that has been provided, is as follows.

  • DB Down
  • RTS Daemon Down
  • Listener Stop

Back To Top

SUB) Navigation Panel Hide

If you want to see the full view of the monitoring area, click on the Navigation Panel Hide icon. 20

Back To Top

SUB) Instance Name & Business Name

Choose whether to view the current monitoring target instance by the instance name or the business name.

20

Back To Top

SUB) Group Name

The Group Name displays the group names of all the instances currently being monitored. When you click on the group name, only the instances that belong to the corresponding group will be displayed on the Monitoring Area. However, the Instance List will still display an entire list of all the instances.

Note. At the bottom of OVERALL, a list of all the instances currently being monitored is displayed.

Back To Top

SUB) Lock & Alarm

The Lock & Alarm provides the lock wait session count and the number of alerts currently being generated.

  • LOCK : Provides the number of lock wait sessions. When you click on it, Lock Tree Frame will pop up.
  • ALARM: Provides the number of alarms currently being generated. Alert Log History Frame will pop up.

Back To Top

SUB) Minimize Instance

When you click on the Minimize Instance icon 21 , it will hide the list of instances within the corresponding group. Click on it again, and the instance list will reappear.

Back To Top

SUB) Refresh Control & Info

Item Description
 22 Provides the Auto refresh enable/disable function.

  • Check : Enables Auto Refresh
  • Uncheck: Disables Auto Refresh
 23 In Auto Refresh Enable state,

you need to set the Refresh cycle.

 24 Displays the Last Refresh time.
 25 Provides the Manual Refresh function.  Only operates in Auto Refresh Disable state.

Back To Top

SUB) Predefined View & Save Layout

The Trend View offers the following 3 views.

View Name Description
Default Provides a view appropriate for intermediate level DBA’s.
Easy Provides a view appropriate for beginner level DBA’s.
Expert Provides a view appropriate for advanced level DBA’s.

Besides the 3 predefined views, the Trend View can save 4 additional window layouts.  For instructions on how to save the window layout, reference the “Chapter 2. Save Window Layout” section.

Back To Top

RAC View

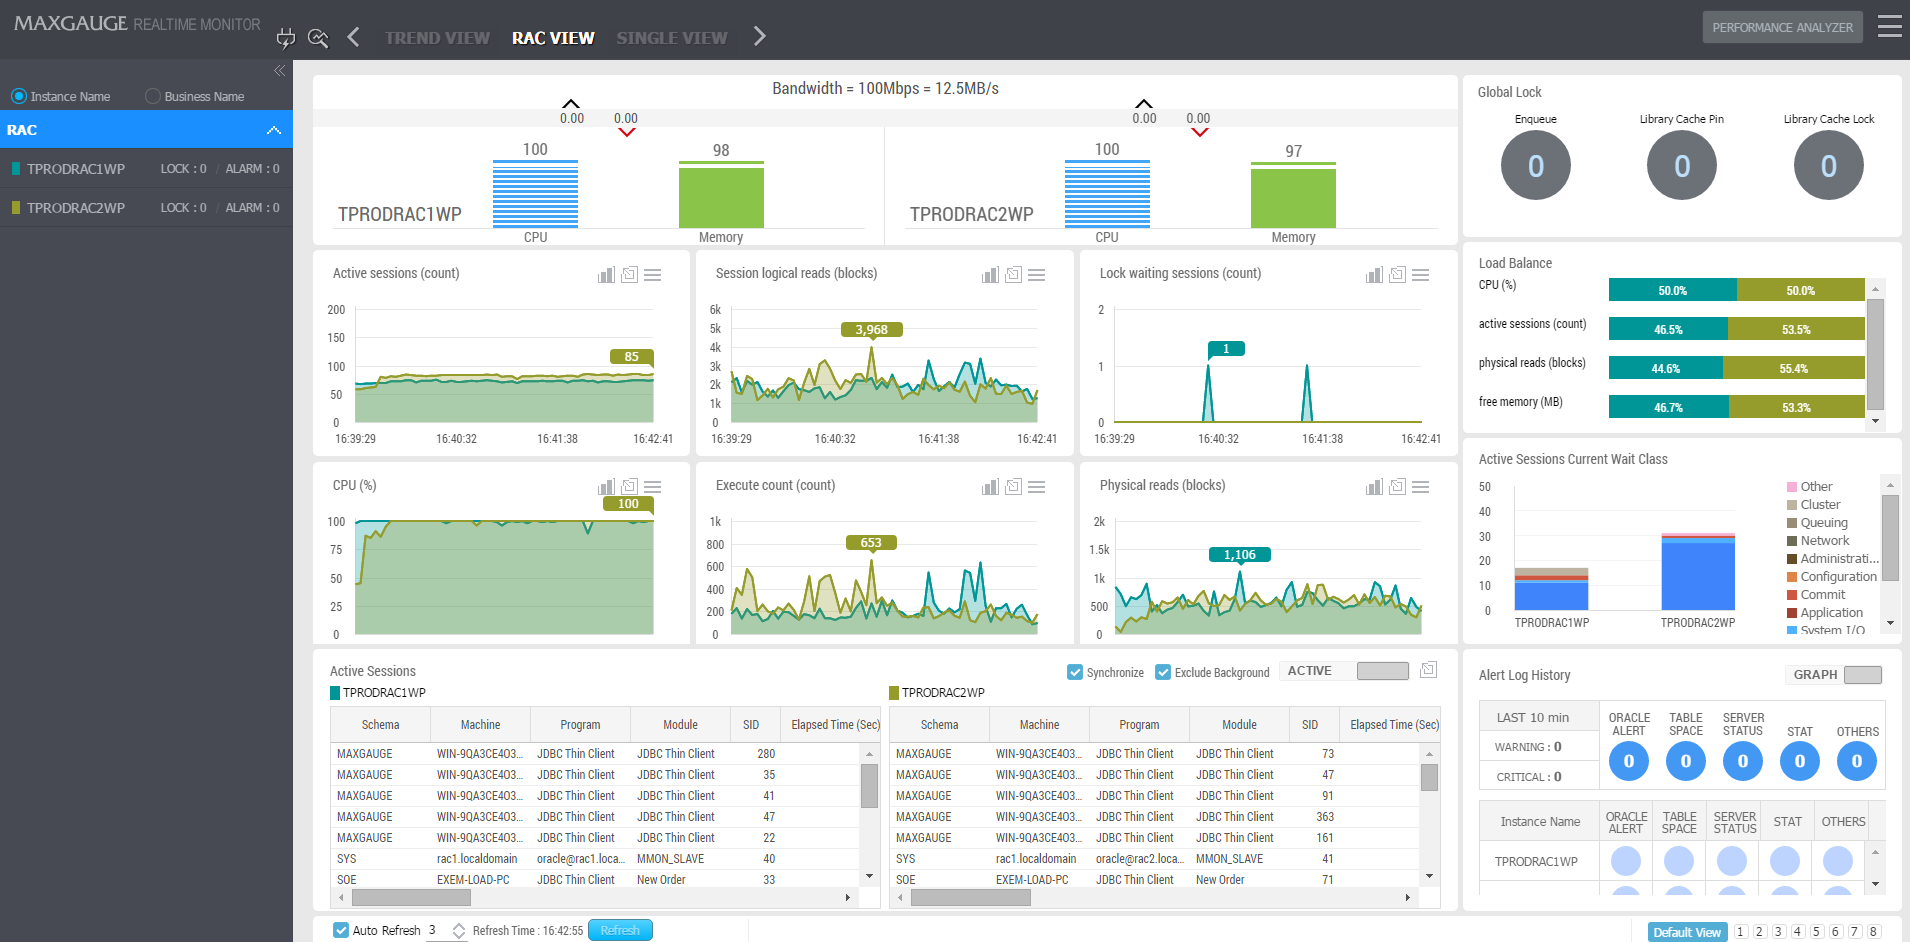
The RAC View is used for monitoring instance groups within the RAC. The RAC View ‘s default window will look like the following.

26

The RAC View UI is similar to the Trend View UI, except the Monitoring Area.  The only differences from the Trend View UI are as follows.

  • It does not provide the Instance List
  • It does not provide OVERALL from the Navigation Panel.

Back To Top

Single View

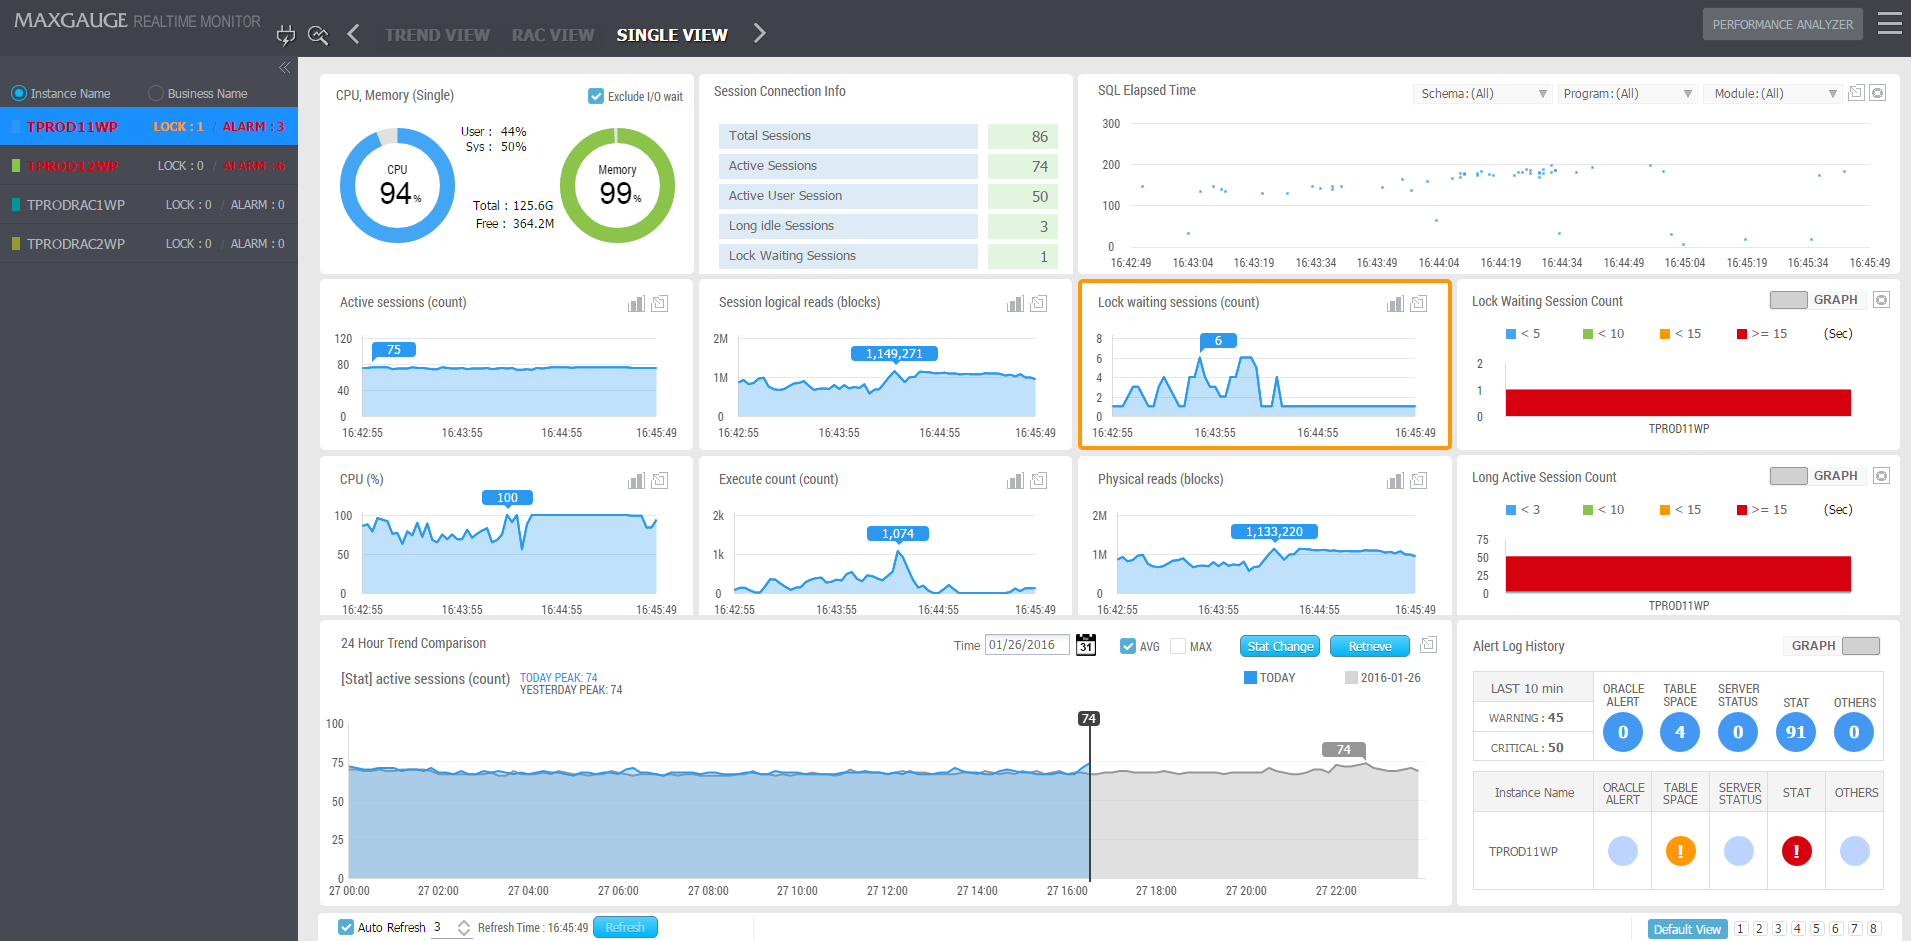
The Single View is used for monitoring individual instances. The Single View’s default window will look like the following.

27


The Single View UI will be similar to the Trend View UI, except the Monitoring Area.  The only differences from the Trend View UI are as follows.

  • It does not provide an Instance List area.
  • It does not provide Group in the Navigation Panel.

Back To Top